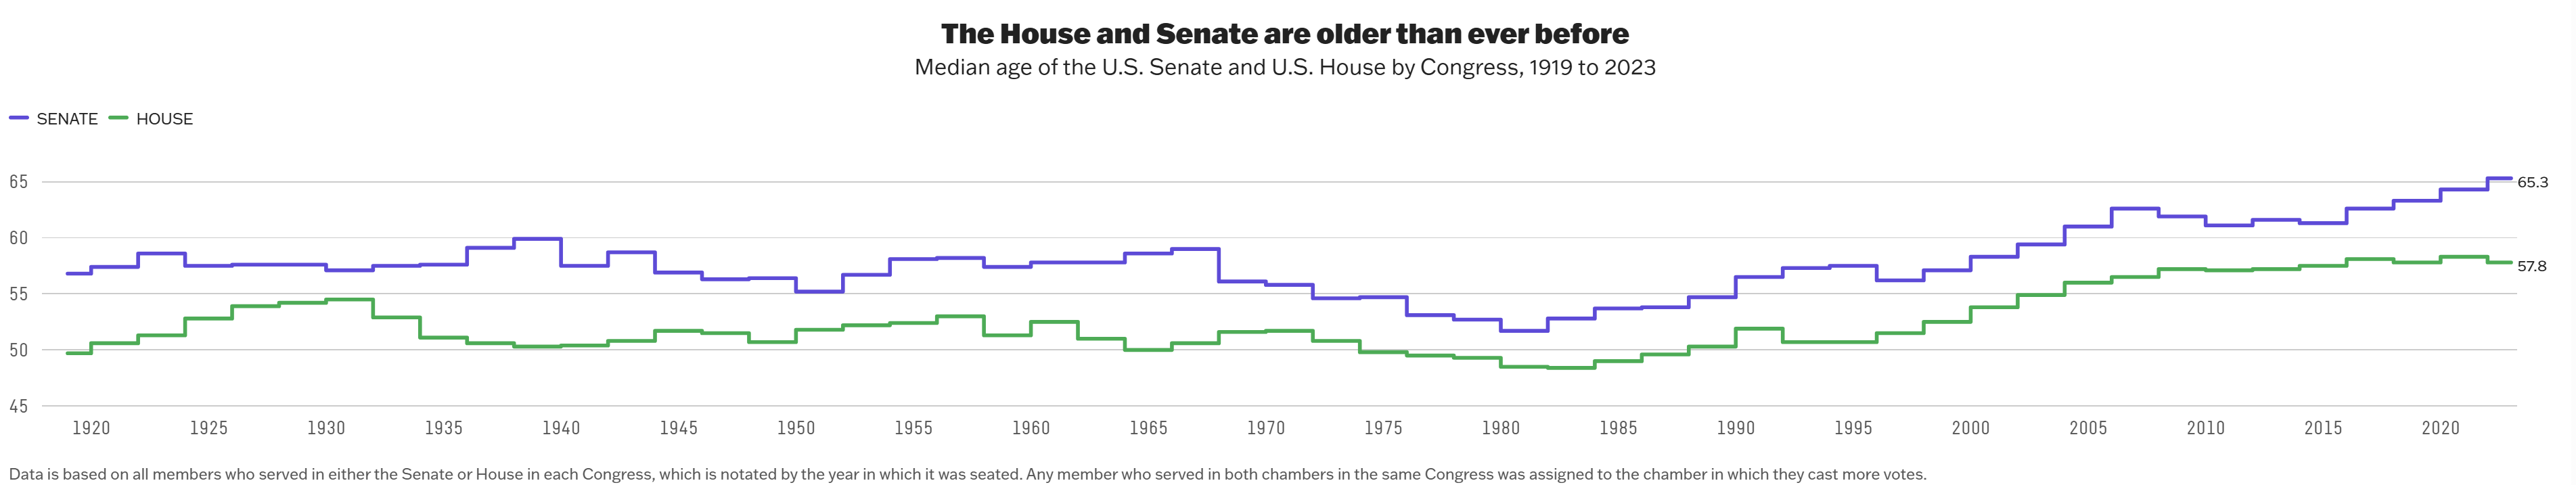
I am attempting ot replicate the figures shown at: https://fivethirtyeight.com/features/aging-congress-boomers/
library(dplyr)
Attaching package: 'dplyr'
The following objects are masked from 'package:stats':

    filter, lag
The following objects are masked from 'package:base':

    intersect, setdiff, setequal, union
library(ggplot2)
Warning: package 'ggplot2' was built under R version 4.4.3
library(lubridate)
Attaching package: 'lubridate'
The following objects are masked from 'package:base':

    date, intersect, setdiff, union
library(gt)
Warning: package 'gt' was built under R version 4.4.3
Load Data
This data_aging_congress.csv is from fivethirtyeight.com. It can be found at the following link: https://github.com/fivethirtyeight/data/blob/master/congress-demographics/data_aging_congress.csv
congress – The number of the Congress that this member’s row refers to.
start_date – First day of a Congress.
chamber – The chamber a member of Congress sat in: Senate or House.
state_abbrev – The two-letter postal abbreviation for the state a member represented.
party_code – A code indicating a member’s party, based on the system used by the Inter-university Consortium for Political and Social Research. Most common values: 100 = Democrat, 200 = Republican, 328 = Independent.
bioname – Full name of the member of Congress.
bioguide_id – Code used by the Biographical Directory of the United States Congress to uniquely identify each member.
birthday – Date of birth for a member.
cmltv_cong – The cumulative number of Congresses a member has served in (inclusive of the listed Congress), regardless of chamber. E.g., 1 indicates a member’s first Congress.
cmltv_chamber – The cumulative number of Congresses a member has served in a specific chamber. E.g., a senator with 1 indicates it’s their first Congress in the Senate, even if they served in the House before.
age_days – Age in days, calculated as start_date - birthday.
age_years – Age in years, calculated by dividing age_days by 365.25.
generation – Generation the member belonged to, based on the year of birth.
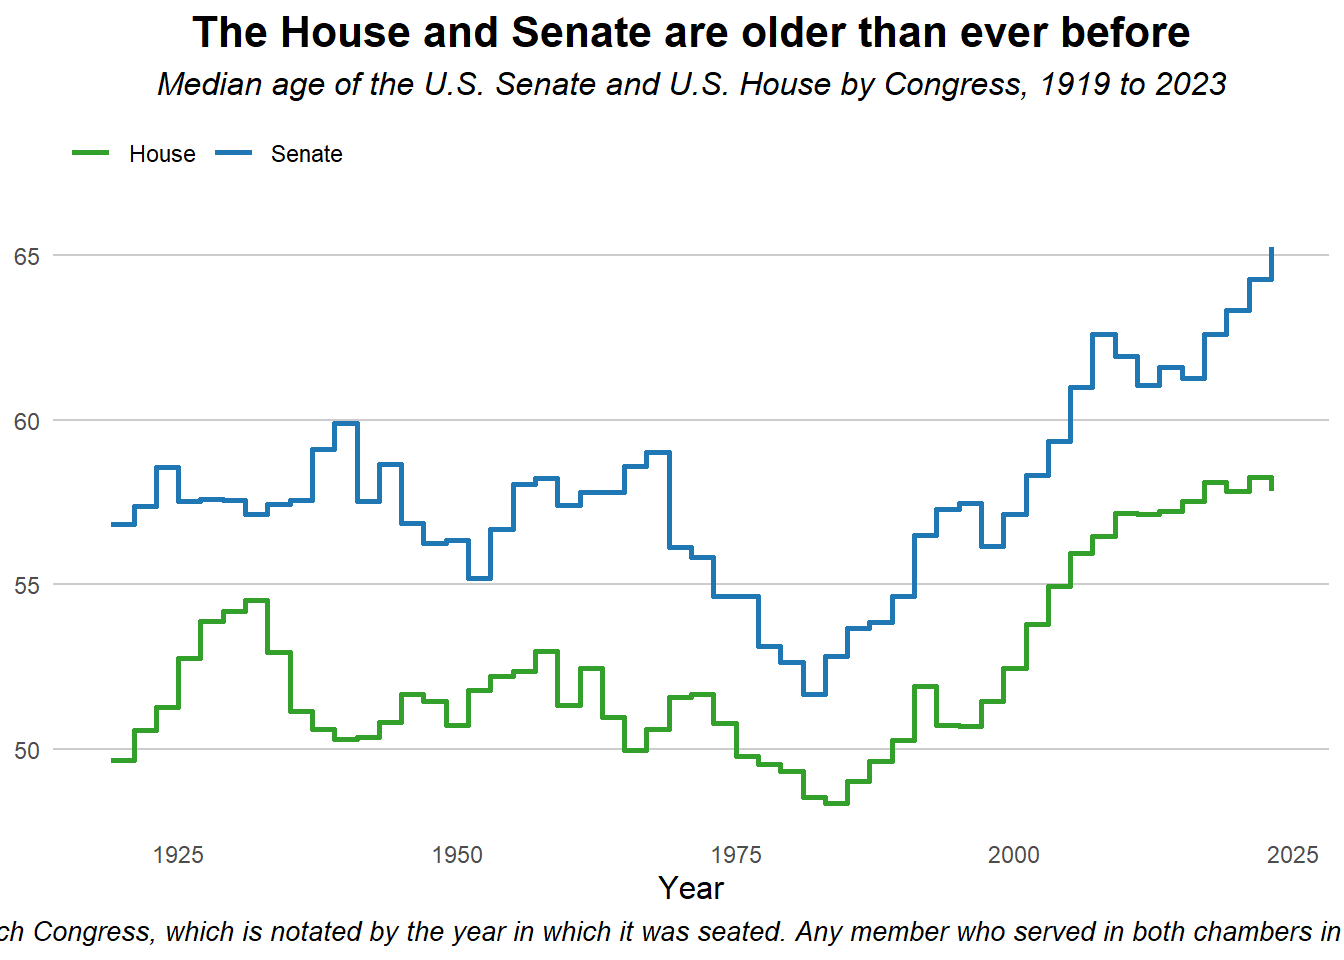
Using this data set, I would like you to create a line graph in R representing the median age of the house and senate through the years 1919-2023. I want the line graph with the x-axis being years and and the y-axis being median age. The columns in this dataset are congress” “start_date” “chamber” “state_abbrev” “party_code” “bioname” “bioguide_id” “birthday” “cmltv_cong” “cmltv_chamber” “age_days” “age_years” “generation”
I then had to specify I wanted the line graphs to only take the data points from odd number years and I want the lines to stay constant and wanted it to take horizontal and vertical steps.
# Convert start_date to Date formatcongress_data$start_date <-as.Date(congress_data$start_date)# Extract year and store in dataframecongress_data$year <-year(congress_data$start_date)# Filter for years 1919–2023filtered_data <- congress_data %>%filter(year >=1919& year <=2023)# Calculate median age by year and chambermedian_age_data <- filtered_data %>%group_by(year, chamber) %>%summarise(median_age =median(age_years, na.rm =TRUE),.groups ="drop" )
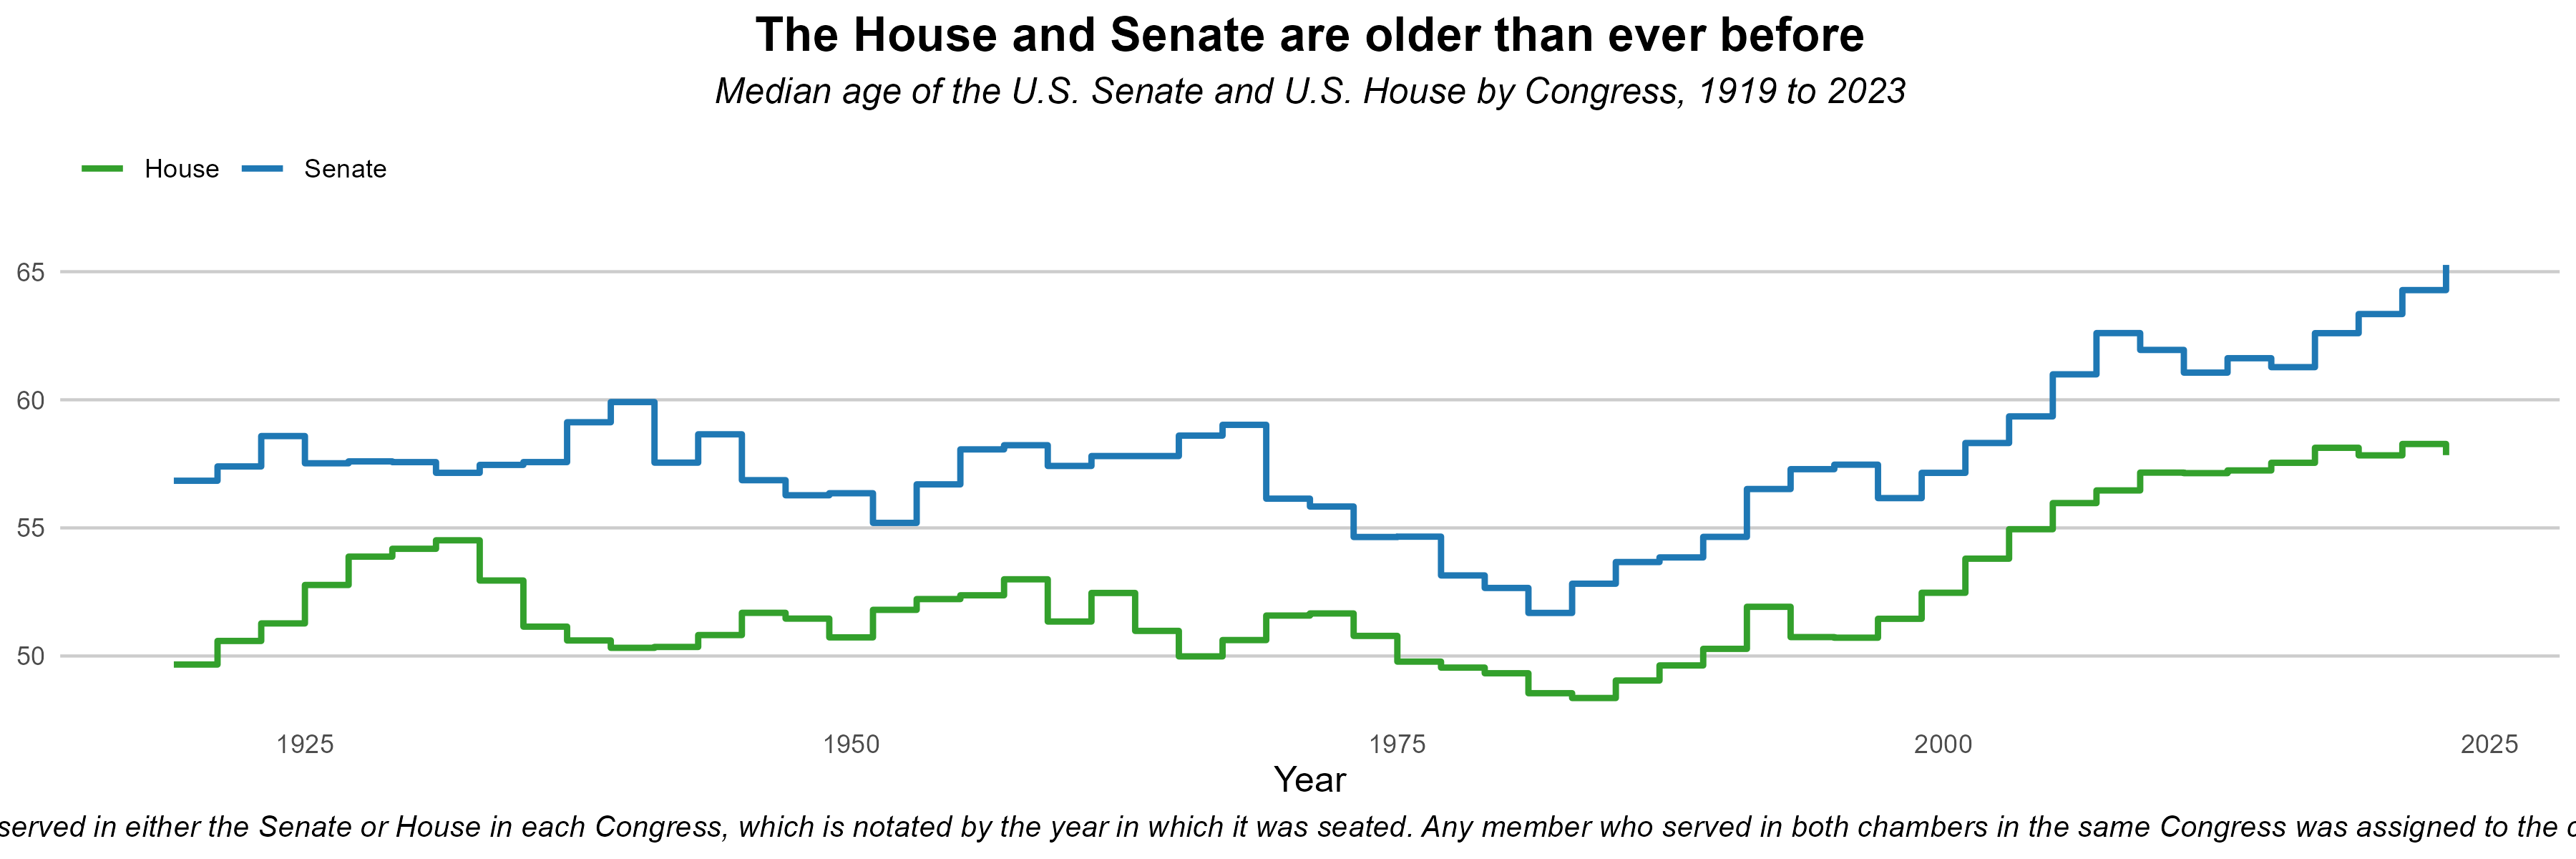
The following code has been manually modified to mimic the original plot more.
# Filter for odd-numbered yearsmedian_age_odd_years <- median_age_data %>%filter(year %%2==1) # Keep only years where year mod 2 = 1 (odd)# Step plotggplot(median_age_odd_years, aes(x = year, y = median_age, color = chamber)) +geom_step(linewidth =1, direction ="hv") +# "hv" makes horizontal then vertical steps#geom_point(size = 2) + labs(title ="The House and Senate are older than ever before",subtitle ="Median age of the U.S. Senate and U.S. House by Congress, 1919 to 2023",x ="Year",y =NULL, color =NULL,caption ="Data is based on all members who served in either the Senate or House in each Congress, which is notated by the year in which it was seated. Any member who served in both chambers in the same Congress was assigned to the chamber in which they cast more votes." ) +scale_color_manual(values =c("House"="#33a02c", "Senate"="#1f78b4")) +theme_minimal() +theme(plot.title =element_text(size =16, face ="bold", hjust =0.5),plot.subtitle =element_text(size =12, face ="italic", hjust =0.5),plot.caption =element_text(size =10, face ="italic", hjust =0.5),axis.title.y =element_blank(),axis.title.x =element_text(size =12),panel.grid.major.x =element_blank(),panel.grid.minor.x =element_blank(),panel.grid.major.y =element_line(color ="grey80"),panel.grid.minor.y =element_blank(),legend.position ="top", # place legend above the plotlegend.justification ="left", # align legend to leftlegend.background =element_rect(fill ="transparent", color =NA), # transparent boxlegend.key =element_rect(fill ="transparent", color =NA) # transparent keys )
The table below depicts the overall median age of both Congress chambers throughout 1919-2023. It includes automatically calculated statistics like standard deviation of median age throughout the time period, the minimum median age, and the maximum median age.
I gave ChatGPT the prompt:
“Using this dataset, write an R script that would produce a publish worthy figure that creates a table that calculates the statistics of the median ages of congress representatives in odd number years. Please, include bold text, colored cells, and a caption.”
Things like caption, color, titles, etc. were manually edited to acheive the visual I wanted.
# Keep only odd-numbered yearsmedian_age_odd <- median_age_data %>%filter(year %%2==1)# Creates a summary table that contains all the calculated statistics for the median agessummary_table <- median_age_odd %>%group_by(chamber) %>%summarise(Mean_Median_Age =mean(median_age, na.rm =TRUE),SD_Median_Age =sd(median_age, na.rm =TRUE),Min_Median_Age =min(median_age, na.rm =TRUE),Max_Median_Age =max(median_age, na.rm =TRUE),N_Years =n(),.groups ="drop" )
publish_table <- summary_table %>%gt() %>%# Rename column labelscols_label(Mean_Median_Age ="Mean Age",SD_Median_Age ="SD Age",Min_Median_Age ="Min Age",Max_Median_Age ="Max Age",N_Years ="Observations" ) %>%# Title + Captiontab_header(title =md("**Table 1. Trends in Median Age of U.S. Congress (1919–2023)**"),subtitle ="Summary statistics using odd-numbered Congress start years" ) %>%# Format numbersfmt_number(columns =c(Mean_Median_Age, SD_Median_Age, Min_Median_Age, Max_Median_Age),decimals =1 ) %>%# Bold column labelstab_style(style =cell_text(weight ="bold"),locations =cells_column_labels(everything()) ) %>%# Conditional formatting (automatic color scale)data_color(columns = Mean_Median_Age,colors = scales::col_numeric(palette =c("#33a02c", "#FFFFBF", "#1f78b4"),domain =NULL ) ) %>%# Add footnotetab_footnote(footnote ="Median age calculated at the start of each Congress. N_Years represents number of odd-year observations.",locations =cells_title(groups ="title") ) %>%# Align nicelycols_align(align ="center",columns =everything() ) %>%tab_options(table.font.size ="small" )
Warning: Since gt v0.9.0, the `colors` argument has been deprecated.
• Please use the `fn` argument instead.
This warning is displayed once every 8 hours.
publish_table
Table 1. Trends in Median Age of U.S. Congress (1919–2023)1
Summary statistics using odd-numbered Congress start years
chamber
Mean Age
SD Age
Min Age
Max Age
Observations
House
52.5
2.8
48.4
58.3
53
Senate
57.8
2.9
51.7
65.3
53
1 Median age calculated at the start of each Congress. N_Years represents number of odd-year observations.
I wanted to include an additional table. The table below calculates the age distribution in congress by political party. I wanted to investigate wether there was a significant difference in the average age of representatives between the parties.
I gave ChatGPT the prompt:
“Using this dataset, write an R script that would produce a publish worthy figure that creates a table that calculates the differenes in median age between political parties. Please, include bold text, colored cells, and a caption.”
Code was manually modified to be compatible with my already written workflow and variables.
party_table <- party_summary %>%gt(groupname_col ="chamber") %>%# Rename column labelscols_label(Mean_Age ="Mean Age",Median_Age ="Median Age",SD_Age ="Standard Deviation",N ="Observations" ) %>%tab_header(title =md("**Table 1. Age Distribution of U.S. Congress by Political Party (1919–2023)**"),subtitle ="Summary statistics using odd-numbered Congress start years" ) %>%fmt_number(columns =c(Mean_Age, Median_Age, SD_Age),decimals =1 ) %>%# Bold column labelstab_style(style =cell_text(weight ="bold"),locations =cells_column_labels(everything()) ) %>%# Conditional formatting on Mean Agedata_color(columns = Mean_Age,colors = scales::col_numeric(palette =c("#33a02c", "#FFFFBF", "#1f78b4"),domain =NULL ) ) %>%cols_align(align ="center",columns =everything() ) %>%tab_footnote(footnote ="Mean and median ages are calculated at the start of each Congress.",locations =cells_title(groups ="title") ) %>%tab_options(table.font.size ="small",data_row.padding =px(4) )party_table
Table 1. Age Distribution of U.S. Congress by Political Party (1919–2023)1
Summary statistics using odd-numbered Congress start years
party
Mean Age
Median Age
Standard Deviation
Observations
House
Democrat
52.8
52.2
11.0
12852
Other
52.8
54.4
11.1
82
Republican
52.8
52.7
10.2
10688
Senate
Democrat
57.6
57.4
10.6
2952
Other
60.2
58.4
12.4
53
Republican
58.1
58.0
9.9
2493
1 Mean and median ages are calculated at the start of each Congress.